Customer Segmentation with K-Means



Overview
Final project of Module 33 — Advanced Models (Profissão Cientista de Dados). Segments 200 shopping mall customers with the K-Means clustering algorithm based on age, annual income and Spending Score, interprets the groups and proposes business strategies for each segment.
Highlights
- 5 well-defined segments: silhouette 0.555 and Davies-Bouldin 0.572
- Choice of k validated by 4 criteria: elbow, silhouette, Davies-Bouldin and Calinski-Harabasz
- Two scenarios compared (2D and 3D), with PCA to visualize the age-based model
- An insights block at the end of each analysis in the notebook
- Reproducible environment with
uvand Docker
Project Structure
customer-segmentation-kmeans/
├── data/Mall_Customers.csv
├── notebooks/segmentacao_clientes_kmeans.ipynb
├── reports/figures/          # charts exported by the notebook
├── Dockerfile / .dockerignore
├── pyproject.toml / uv.lock
└── README.md
Tech Stack
| Technology | Role |
|---|---|
| Python 3.13 | Main language |
| pandas / NumPy | Data manipulation |
| scikit-learn | K-Means, StandardScaler, PCA and cluster metrics |
| Matplotlib / Seaborn | Visualizations |
| Jupyter | Notebook with the full analysis |
| uv / Docker | Dependency management and reproducible execution |
Methodology
- Exploration: data quality (nulls, duplicates, valid ranges), distributions, IQR outliers, analysis by gender and correlations.
- Preprocessing:
CustomerIDremoved;Genderleft out of the model (binary and not discriminative) and used only to describe the groups; income outliers kept as plausible values; standardization withStandardScaler. - Modeling: K-Means with
k-means++andn_init=10in two scenarios: A (Income + Score) and B (Age + Income + Score). - Evaluation: k from 2 to 10 compared by elbow, silhouette, Davies-Bouldin and Calinski-Harabasz, plus per-cluster silhouette plots.
| Scenario | k | Silhouette ↑ | Davies-Bouldin ↓ | Calinski-Harabasz ↑ |
|---|---|---|---|---|
| A: Income + Score | 5 | 0.555 | 0.572 | 248.6 |
| B: Age + Income + Score | 6 | 0.428 | 0.825 | 135.1 |
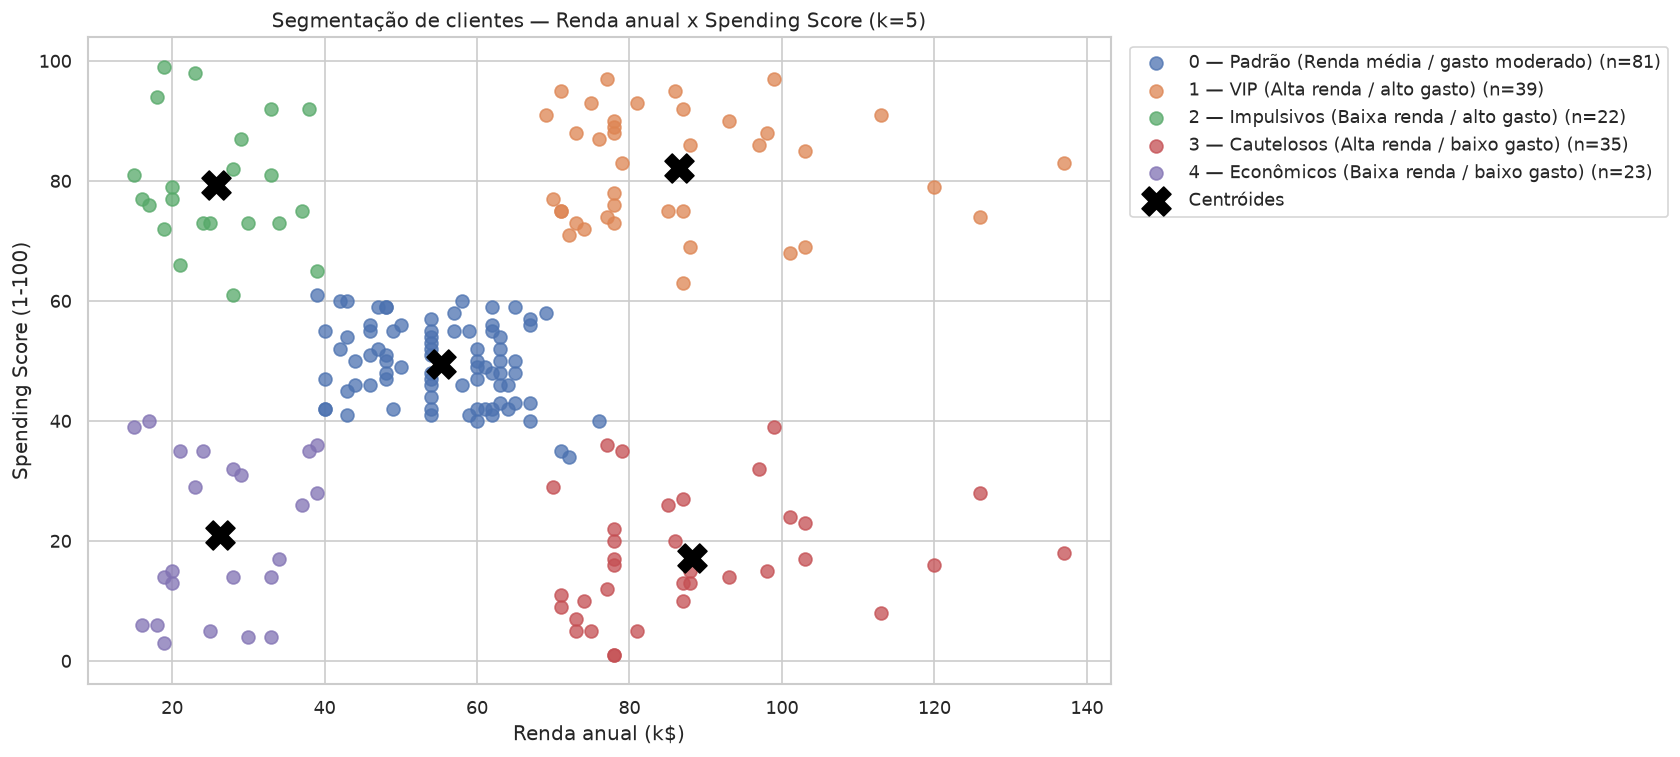
Scenario A was chosen as the main segmentation. Scenario B reproduces the same groups and splits the "Standard" segment into young and mature customers.
Segments Found
| Segment | Customers | Avg. age | Avg. income (k$) | Avg. score | Strategy |
|---|---|---|---|---|---|
| VIP (high income / high spending) | 39 | 32.7 | 86.5 | 82.1 | Premium loyalty and exclusive events |
| Cautious (high income / low spending) | 35 | 41.1 | 88.2 | 17.1 | Highest potential: value offers and convenience |
| Standard (mid income / moderate spending) | 81 | 42.7 | 55.3 | 49.5 | Volume campaigns and cross-selling |
| Impulsive (low income / high spending) | 22 | 25.3 | 25.7 | 79.4 | Flash sales and fast fashion |
| Thrifty (low income / low spending) | 23 | 45.2 | 26.3 | 20.9 | Clearance sales and cashback |
Key insights
- Income alone does not explain spending: VIP and Cautious have similar income and opposite behavior.
- Younger customers spend more (−0.33 correlation between age and score).
- Gender barely differentiates the segments.
- Highest current value in VIP; highest growth potential in Cautious.
How to Run
Note
The notebook and analysis are written in Portuguese.